What we do
Our specialist nurses, known as Admiral Nurses, provide free, expert advice, support and understanding to help families care for their loved one
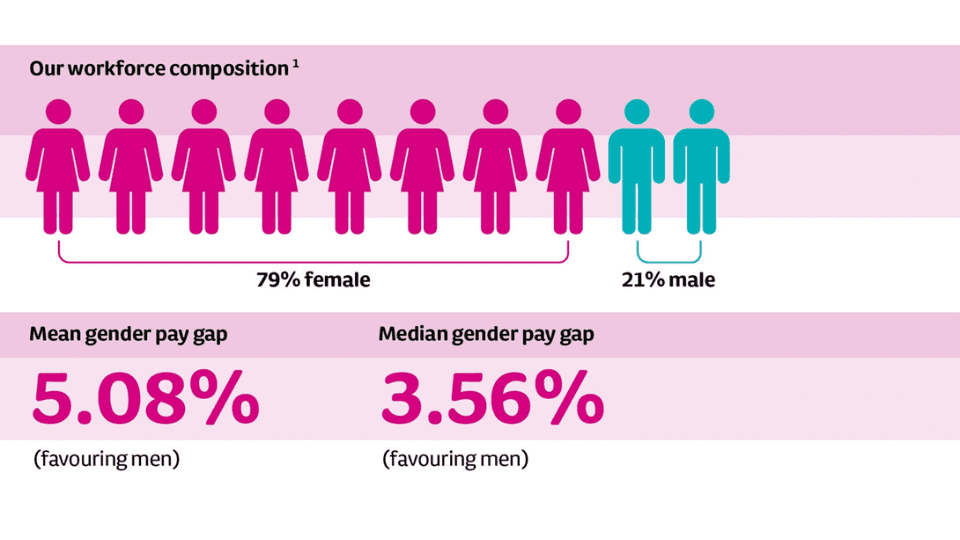
We are committed to creating a great place to work for our teams, empowering them to do their best work to improve the lives of families affected by dementia. Dementia UK has seen rapid growth in recent years to enable us to reach more people who need our help. In 2025 our headcount exceeded 250, making this the first year we are legally required to report our gender pay gap data.
A gender pay gap measures the difference in the average pay of all men and all women in an organisation, regardless of role. A gender pay gap is influenced primarily by workforce composition and the distribution of roles across an organisation.
It is different from equal pay, which compares pay for men and women performing the same or similar roles, or work of equal value.
The mean: this involves adding up all of the numbers and dividing the result by how many numbers were on the list. This places the same value on every number, so can be distorted by a small number of very low or high earners.
The median: this involves listing all of the numbers in numerical order and taking the middle number. This indicates what the ‘typical’ situation is, as outliers will not affect the median.
The gender pay gap report uses a data snapshot taken on 5th April 2025. The total number of employees on the snapshot date was 316. In line with legal requirements, four individuals were excluded from the report, as they were not in receipt of their normal pay on 5th April 2025 due to absence or maternity leave. The data includes sessional Admiral Nurses.
1Gender pay gap reporting requires analysis based on sex assigned at birth, rather than gender identity. We recognise that some individuals may not identify with the male or female categories as used in the report.
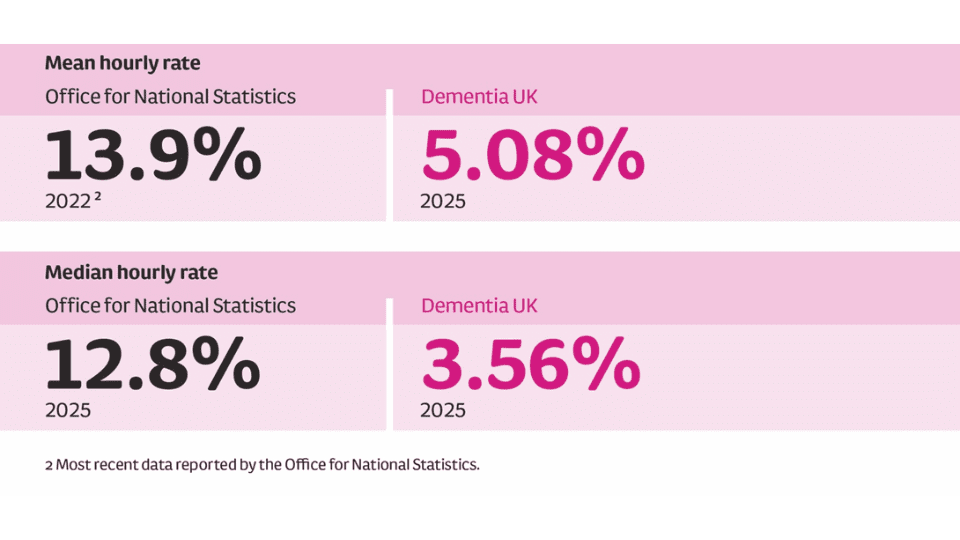
Our results are significantly below both the national mean and median figures as published by the Office for National Statistics.
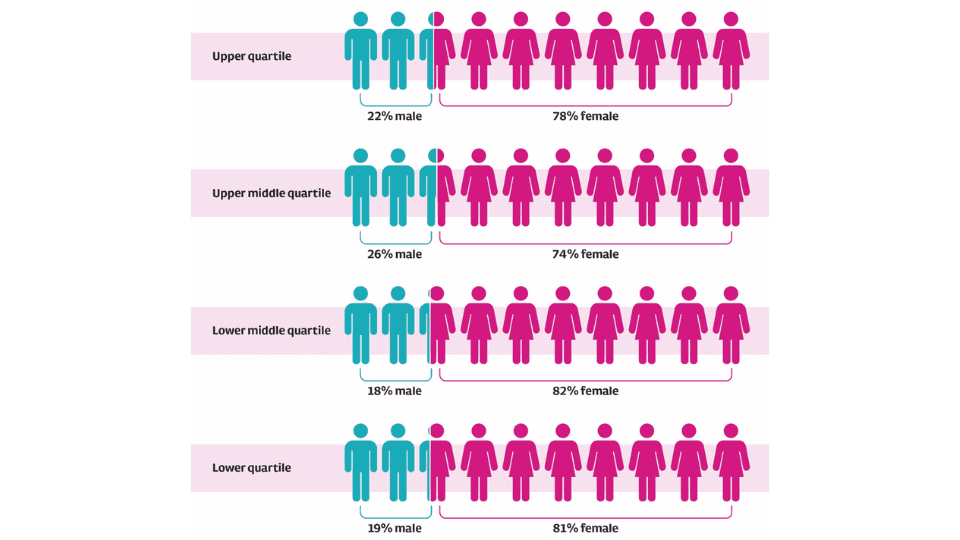
When reviewing the distribution of female and male employees within the quartiles, we can see from the chart below that female employees are very well represented across all pay quartiles, with the strongest representation found in the two lowest pay quartiles.#
When reviewing the distribution of female and male employees within the quartiles, we can see from the chart below that female employees are very well represented across all pay quartiles, with the strongest representation found in the two lowest pay quartiles.
In April 2025, we introduced a pay and grading structure to provide clarity and transparency to our employees on how their pay is determined. This included:
This helps us to ensure pay decisions are objective, consistent and gender-neutral.
Although our gender pay gap is below the national average, we are committed to continuous improvement. Our priorities include:
Our 2025 results demonstrate a stable and comparatively low gender pay gap during a period of rapid organisational growth. We remain committed to ensuring fairness, transparency and opportunity for all colleagues.
Our specialist nurses, known as Admiral Nurses, provide free, expert advice, support and understanding to help families care for their loved one

By joining us, you will become part of a diverse and dedicated team of people.

Dementia UK is an inclusive charity making a difference to families impacted by dementia. Find out about current roles.